Rarefaction
 See also
Alpha diversity
Octave plots
Estimating sampling effort
alpha_div_rare command
fastx_subsample command
otutab_rare command
Abundance rarefaction
Rarefaction is a technique from numerical ecology that is often applied to OTU analysis. However, with NGS reads, low-abundance OTUs are often spurious , and rarefaction analysis is therefore of dubious value.
The goal of rarefaction is determine whether sufficient observations have been made to get a reasonable estimate of a quantity (call it R) that has been measured by sampling.
The most commonly considered quantity is species richness (the number of different species in an environment or ecosystem), though similar analysis can be applied to any alpha diversity metric (see alpha_div_rare command ).
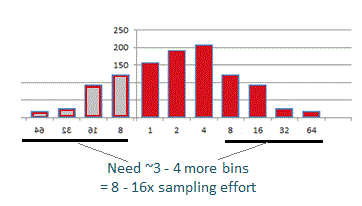
 A better way to estimate whether the full richness of a community has been sample is to review an octave plot .
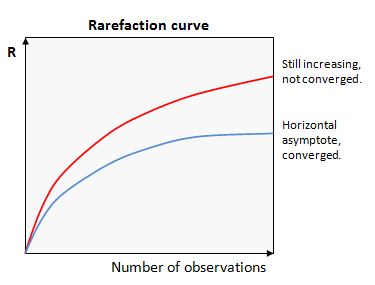
Rarefaction analysis plots the value of a measured quantity (call it R) against the number of observations used in the calculation. Values of R for smaller numbers of observations are obtained by taking random subsets. If we get a similar value of R with fewer observations, then it is reasonable to infer that R has converged on a good estimate of the correct value. Conversely, if R is systematically increasing or decreasing as more samples are added, then we can infer that we cannot make a good estimate of R for the full population.
These two cases are shown in the figure. In this example, the upper curve (red) is still increasing, so has not converged. The lower curve (blue) has reached a horizontal asymptote, so we can infer that the value of R is a good estimate of the value that would be obtained if every individual was observed at least once.
This type of plot is called a "rarefaction curve". Note that the conclusions we can draw from a rarefaction curve are suggestive but not definitive -- there could be rare species that have not yet been observed even if the curve appears to converge.
If R does not converge, there are two possibilities: we need more samples to get a good estimate, e.g. because we have not yet observed all the taxa present, or spurious OTUs due to sequencing error increases indefinitely with the number of reads, in which case the measured R might increase indefinitely. This effect is commonly seen with the number of OTUs. Suppose there is a fixed probability that a read has >3% bad bases and will thus induce a spurious OTU. As the number of reads increases, the number of OTUs will increase due to these bad reads, regardless of whether all the species in the sample have been detected. The number of OTUs will therefore never converge. This is usually the case in practice, because it is impossible to completely eliminate spurious OTUs.
There is a standard formula for calculating the rarefaction curve for richness given the observed abundances, but this formula is not quite correct if singleton reads are discarded , as recommended in the UPARSE pipeline . See abundance rarefaction for further discussion. I doubt it matters in practice, because other sources of error are probably more important , so rarefaction analysis has dubious value for marker gene OTUs.

