Uneven bin boundaries distort abundance distribution shape
See also
Octave plots
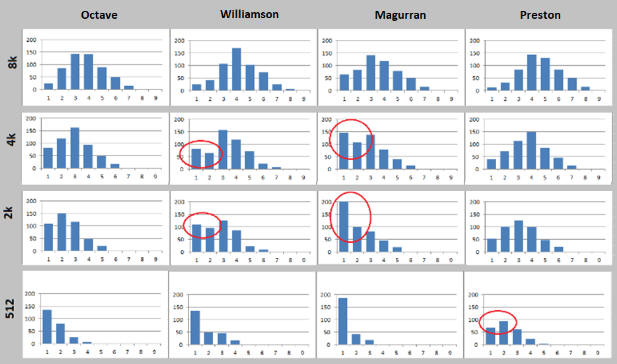
The figure below is from (Edgar and Flyvbjerg 2018). All histograms were
generated from the same simulated log-normal abundance distribution. The
histograms in a given row are generated from an identical incomplete
enumeration of this distribution, i.e. a set of simulated reads which does
not capture all OTUs in the sample. From top to bottom, the enumerations
contain 8k, 4k, 2k and 512 reads, respectively. Binning rules are: Octave
(Edgar and Flyvbjerg 2018), Williamson (Williamson and Gaston, 2005),
Magurran (Magurran, 2004) and Preston (Preston, 1948). Shape distortions are
circled in red. Octave binning is the only method that preserves the shape
without misleading distortions. Bins are labeled 1, 2 ... 9 in order of
increasing abundance.