Read quality filtering validation
See also
UPARSE benchmark home
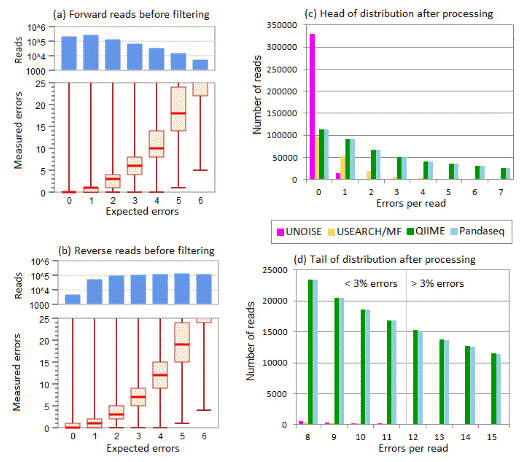
Below is Fig 3 from Edgar & Flyvbjerg (2015) . This shows (1) that expected errors correlate well with empirically measured errors, and (2) that expected error filtering is much more effective than the QIIME quality filter and PANDAseq .

Results on the box/whisker plots in panels (a) and (b) show the correlation between expected errors (E) and measured errors before filtering in the forward and reverse reads respectively. E is rounded to integers and binned so that, e.g., the bin for E=2 contains reads with 1.5<=E< 2.5. For each bin, the top and bottom of the box indicates the upper and lower quartile, respectively, and the line inside the box indicates the median value. The upper and lower whiskers indicate the maximum and minimum measured errors, respectively. In all cases, the maximum value is >25 and is probably explained by a read that is a PCR artifact, such as an unfiltered chimera, with true number of sequencing errors much less than 25. The upper histograms in panels (a) and (b) show the numbers of reads falling into each E bin. This shows that the reverse reads have more reads with lower quality, as is typically seen with Illumina sequencing. However, the correlation seen
in the box/whisker plots appear similar between the forward and reverse reads, suggesting that the Q score accuracy is comparable. These results show that E tends to underestimate the number of errors for larger values of E. The histograms in panels (c) and (d) report the distribution after merging and filtering of the observed numbers of errors per read in the head (<3% errors) and tail (>3% errors) respectively, showing that Emax=1 allows most reads with no errors and a majority of reads with one error, and further dramatically reduces the frequency of reads in the tail compared with QIIME and PANDAseq.

