Diversity analysis
 See also
OTU / denoising pipeline
Alpha diversity
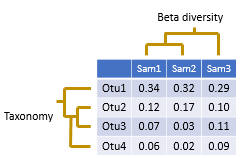
Beta diversity
Microbial taxonomy
Rarefaction
Which taxonomy database should I use?
Interpreting diversity metrics
Recommended alpha and beta metrics
Comparing alpha diversity between groups
Statistical significance of diversity differences
Diversity analysis investigates questions such as "how many species are in a sample?" and "how similar are these two samples?". The diversity in a single sample is called alpha diversity , and the diversity (differences or similarities) between two samples is called beta diversity .
The input data used for diversity analysis is an OTU table . A tree for the OTUs is also needed for UniFrac beta diversity analysis , this can be created using the cluster_agg command.
 Usearch supports diversity analysis through the alpha_div , alpha_div_rare and beta_div commands. These commands support several popular diversity metrics.
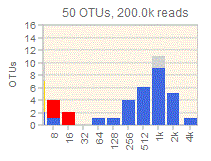
You can visualize diversity using octave plots .
Note that most standard diversity metrics are difficult to interpret or invalid for NGS OTUs .
You can test for statistically significant differences in alpha diversity between groups by using the alpha_div_sig command .
Taxonomy for the OTU sequences can be predicted using the sintax command . See also Which taxonomy database should I use?
A tree for the OTU sequences can be generated using the cluster_aggd command .