Beta diversity
 See also
Diversity analysis
Beta diversity metrics
beta_div command
Interpreting diversity metrics
Recommended alpha and beta metrics
Comparing alpha diversity between groups
Statistical significance of diversity differences
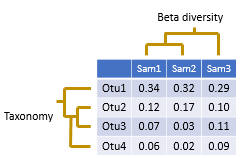
Beta diversity compares two sample. Usually, this is done by calculating a number that indicates the similarity or difference between the samples. Often, but not always, the number is in the range zero to one.
The pair-wise comparisons for a set of samples can be presented in a distance matrix .In usearch, beta diversities are always difference measures, not similarity measures, so increasing values indicate lower similarity and increasing distance. For distance measures D that ranges between zero and one there is always an equivalent similarity measure S defined by S = 1 - D , for example (Jaccard similarity) = 1 - (Jaccard distance). You can easily convert between distance and similarity measures in a spreadsheet program such as Excel.
Samples can be clustered to bring similar samples together, producing a tree, as shown in the figure above. In usearch, this can be done using the beta_div command, which automatically generates sample trees, or by using the cluster_aggd command to cluster a distance matrix generated by beta_div or by third-party software.