See also
Rarefaction
fasta_rarify command
Suppose you observe K different species, finding Nk individuals in the kth species. The sum N = N1+ N2+ ... + NK is the total number of observations. To calculate the rarefaction curve for (number of observed species) vs. (number of observations), we take random subsets with n =1, 2, ... N observations and count the number of species S(n) that are found in each subset. (More accurately, we should average over many different random subsets at each size n until the mean converges). Some species will disappear with fewer observations, and the curve will approach zero species as n approaches zero. It is not actually necessary to implement subsampling and average, S(n) can be calculated using this formula:

This is exact; it is not an approximation. Some special cases are readily determined: S(0) = 0, S(1) = 1, S(N) = K. This formula is described in this Wikipedia article, which gives some useful background but states incorrectly (at the time of writing, Sept 3rd 2014) that the rarefaction curve is "defined" by the above formula, which in fact is valid only when certain assumptions hold, e.g. that singletons are not discarded.
Rarefaction for OTUs
If species with only a single individual observed are ignored, then the
above formula does not apply. Similarly, if singleton
reads are discarded, as recommended in the
UPARSE pipeline, then you cannot use standard rarefaction software and the
above formula does not give the correct result. If singletons are retained, then
the formula is a reasonable approximation, but is not exactly correct because
de novo OTUs are necessarily "unstable", meaning that a given pair of sequences may
belong to the same OTU with one subset but in different OTUs in another subset.
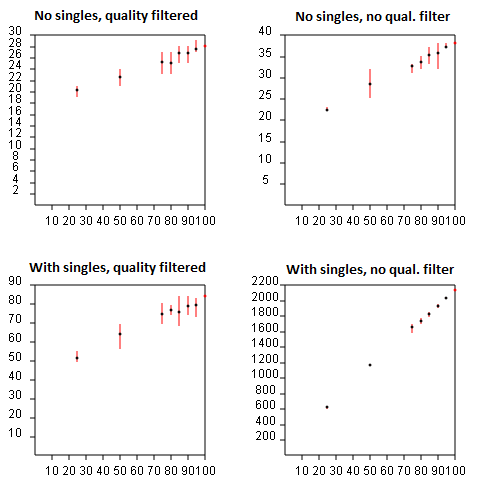
With de novo OTUs, including those made by UPARSE, rarefaction curves must be generated by running the pipeline from scratch for each random subsample and noting the number of OTUs obtained. (If this is too computationally expensive, the fasta_rarify command provides a fast approximate method). A subset of the reads can be generated using the fasta_subsample command. The most efficient implementation is to insert the fasta_subsample step after dereplication so that all the steps through quality filtering and dereplication are only done once. For a given subsample size n, the number of OTUs should be averaged over as many different subsamples as possible. The figures below show rarefaction curves obtained for UPARSE OTUs on a mock community dataset with 21 species. The X axis is the subsample size as a percentage of the total number of reads, and the Y axis is the number of OTUs obtained. The upper plots show results with singletons discarded, in the lower plots singletons are retained. In the left plots, read quality filtering is used, in the right plots no quality filtering was done. This helps investigate the relative benefit of these two error filtering methods. The best result is seen in the upper-left plot, which converges on 28 species (which turns out to be the 21 expected mock community members plus some contaminants). In the other plots, the number of OTUs does not converge, or appears to converge on a higher value, e.g. 40 if quality filtering is not used (upper-right). If no error filtering is performed, the number of OTUs explodes to 2,200 (bottom right), and the rarefaction curve clearly does not converge, implying that many more OTUs would be obtained if the sequencing depth was increased.
