Creating an OTU table
 See also
OTU / denoising pipeline
Defining and interpreting OTUs
Interpreting counts and frequencies in a OTU table
Mapping reads to OTUs
In my approach, OTUs are sequences selected from the reads. The goal is to identify a set of correct biological sequences; see defining and interpreting OTUs for discussion.
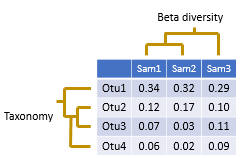
An OTU table is a matrix that gives the number of reads per sample per OTU. One entry in the table is usually a number of reads, also called a "count", or a frequency in the range 0.0 to 1.0. Counts are calculated by mapping reads to OTUs . Note that read abundance has very low correlation with species abundance , so the biological interpretation of these counts is unclear .
An OTU table is created by the otutab command . Input should be reads before quality filtering and before discarding low-abundance unique sequences, e.g. singletons. This will improve sensitivity, because many low-quality and low-abundance reads will map successfully to OTUs. Reads must have sample indenfiers in the labels. The search database is the OTU (or ZOTU) sequences, which must have valid OTU identifiers in the labels.
I suggest making OTU tables for both 97% OTUs and denoised sequences (ZOTUs). Most biological conclusions, e.g. about diversity, should be the same for both tables. If they are not, this suggests that the analysis is not reliable.
Normalizing the table
After generating the table, you should use the otutab_rare command to normalize all samples to the same number of reads.
Example
usearch -otutab reads.fq -otus otus.fa -otutabout otutab.txt -mapout map.txt
usearch -otutab reads.fq -zotus zotus.fa -otutabout zotutab.txt -mapout zmap.txt
usearch -otutab_norm otutab.txt -sample_size 5000 -output otutab_norm.txt
usearch -otutab_norm zotutab.txt -sample_size 5000 -output zotutab_norm.txt